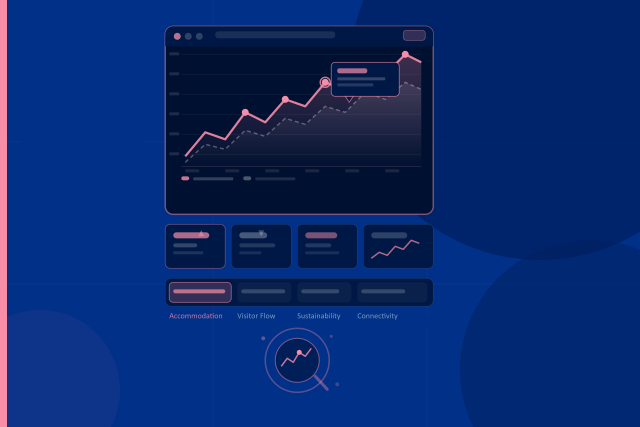
This course provides a detailed walkthrough of the main dashboard families available in the LIBECCIO Destination Management Support System (DMSS). After learning what the DMSS is in the course "Introduction to the LIBECCIO DMSS and how to access and navigate the platform in the course "How to Use the DMSS: Access, Navigation and Interaction", learners now move into the practical interpretation of dashboard content.
The course is designed for learners who need to understand not only how to open a dashboard, but also how to read its indicators, compare panels, interpret visualisations and connect dashboard evidence to destination management questions. It focuses on the main analytical areas of the DMSS, including accommodation markets, visitor demand, economic impact, connectivity, active mobility, social sustainability and operational risk.
The course is suitable for:
- Public governance actors and destination management organisations who use dashboards to support planning, monitoring and policy decisions
- Tourism businesses, private-sector bodies and business support organisations who need market, demand and reputation intelligence
- Consultants, academics, analysts and researchers who use structured tourism data for reporting, advisory work or applied research
By the end of this course, learners will be able to interpret different dashboard types with confidence. They will understand how to read KPI cards, time-series charts, bar charts, maps, tables, methodology panels and comparative indicators. They will also learn how different dashboard families answer different destination management questions and how to avoid misinterpretation when working with multi-source tourism data.
This course is intended as both a structured learning path and a reference guide that learners can return to while working inside the DMSS platform.
Learning Objectives
By completing this course, learners will be able to:
- Recognise the main visual and structural elements of DMSS dashboards
- Read KPI cards, trend charts, bar charts, tables, maps and methodology panels correctly
- Understand how dashboard layout supports interpretation from summary indicators to detailed evidence
- Interpret accommodation price, reputation and establishment mapping dashboards
- Analyse visitor arrivals, demand composition, overnight stays and economic impact indicators
- Read connectivity and mobility dashboards covering airports, ports, routes, attractions and active mobility infrastructure
- Interpret social sustainability dashboards, including accessibility, amenity coverage and inclusive tourism indicators
- Understand operational tourism weather risk dashboards and their alert, hazard and recommendation logic
- Compare indicators responsibly across territories, time periods, categories and dashboard families
- Distinguish between strategic dashboards, operational dashboards and evidence used for reporting or decision support
Course Contents
The course is organised into six learning sections, followed by a self-assessment questionnaire:
Section 1 — Course Overview and Learning Roadmap
Introduces the structure and purpose of the course. Learners understand how the course is organised by dashboard family, what thematic areas will be covered, and how the material can be used both as a guided learning path and as a practical reference while working in the platform.
Section 2 — Dashboard Anatomy: Layout, Visualisation Types and Reading Principles
Introduces the common structure of DMSS dashboards and the main visualisation types used across the platform. Learners explore how to read KPI cards, time-series charts, bar charts, maps, tables, text panels and methodology boxes. The section also explains how to interpret dashboards from top to bottom and how to connect information across panels.
Section 3 — Accommodation Dashboards: Prices, Reputation and Establishment Mapping
Focuses on dashboards related to accommodation markets and business intelligence. Learners examine accommodation price analytics, lead-time comparisons, rolling averages, price segmentation, occupancy-related indicators, reputation scores, dimension gaps, overpricing risk and spatial establishment mapping. The section helps learners understand how accommodation dashboards support both policy and business decision-making.
Section 4 — Visitor and Demand Dashboards: Arrivals, Segmentation and Economic Impact
Explores dashboards that describe visitor flows, tourism demand and economic contribution. Learners work with arrivals, overnight stays, visitor-type breakdowns, territorial distribution maps, accommodation capacity indicators and expenditure by visitor type and service category. The section shows how demand dashboards help explain who visits a destination, where they stay and how tourism activity contributes to the local economy.
Section 5 — Connectivity and Mobility Dashboards: Airports, Ports and Active Mobility
Covers dashboards that describe how visitors reach and move through destinations. Learners examine airport traffic indicators, route connectivity, route performance matrices, maritime passenger flows, seasonality and concentration metrics. The section also introduces active mobility dashboards, including attraction positioning, cycling and walking infrastructure, route maps and mobility-related spatial indicators.
Section 6 — Sustainability and Risk Dashboards: Social Sustainability and Weather Risk
Focuses on dashboards that support inclusive, sustainable and operationally aware destination management. Learners explore social sustainability indicators such as amenity penetration, accessibility coverage, rating effects, price effects, amenity value positioning and accessible accommodation mapping. The section also covers operational weather risk dashboards, including municipal risk scores, hourly hazard evolution, hotspot maps, alert logic, decision indices and recommended actions.
Section 7 — Self-Assessment Questionnaire
Allows learners to check their understanding of the full DMSS dashboard ecosystem. The assessment focuses on interpreting dashboard indicators, recognising visualisation types, identifying correct filter and comparison logic, understanding data-source implications, and explaining how different dashboard families support different destination management questions.
Supplementary Reading
Each dashboard family is supported by detailed reference material that learners can use for deeper self-study. These materials provide additional explanations of dashboard structure, indicator meaning, visual interpretation and responsible use of dashboard evidence.
Learners are encouraged to return to these materials while using the DMSS platform, especially when interpreting unfamiliar dashboards or preparing evidence for reports, presentations or stakeholder discussions.
Prerequisites
Learners are strongly encouraged to complete the following courses before starting this course:
- Introduction to the LIBECCIO DMSS
- How to Use the DMSS — Access, Navigation and Interaction
The course assumes that learners already understand the purpose of the DMSS and are familiar with basic platform access, navigation, filters, time controls, inspection and export functions.
No technical knowledge of databases, programming or Grafana administration is required.
What Learners Will Be Able to Do After This Course
Learners who complete the course will be ready to:
- Open a DMSS dashboard and understand its structure from top to bottom
- Identify the purpose of different dashboard families and their target users
- Interpret accommodation, visitor, economic impact, connectivity, mobility, sustainability and risk indicators
- Explain dashboard findings clearly to colleagues, stakeholders or decision-makers
- Use dashboard evidence responsibly in planning, reporting, advisory work or research
- Recognise when dashboard results require additional context, methodological caution or comparison with other indicators
- Move from basic platform use to meaningful dashboard interpretation and evidence-based decision support
Duration
Approximately 85 minutes of video and reading material-based learning across six learning sections, plus additional time for self-study, platform practice and completion of the self-assessment questionnaire.
- Teacher: Christos Alexakos
- Teacher: Nikitas Kalogeropoulos